Top Countries by Installed Solar Capacity
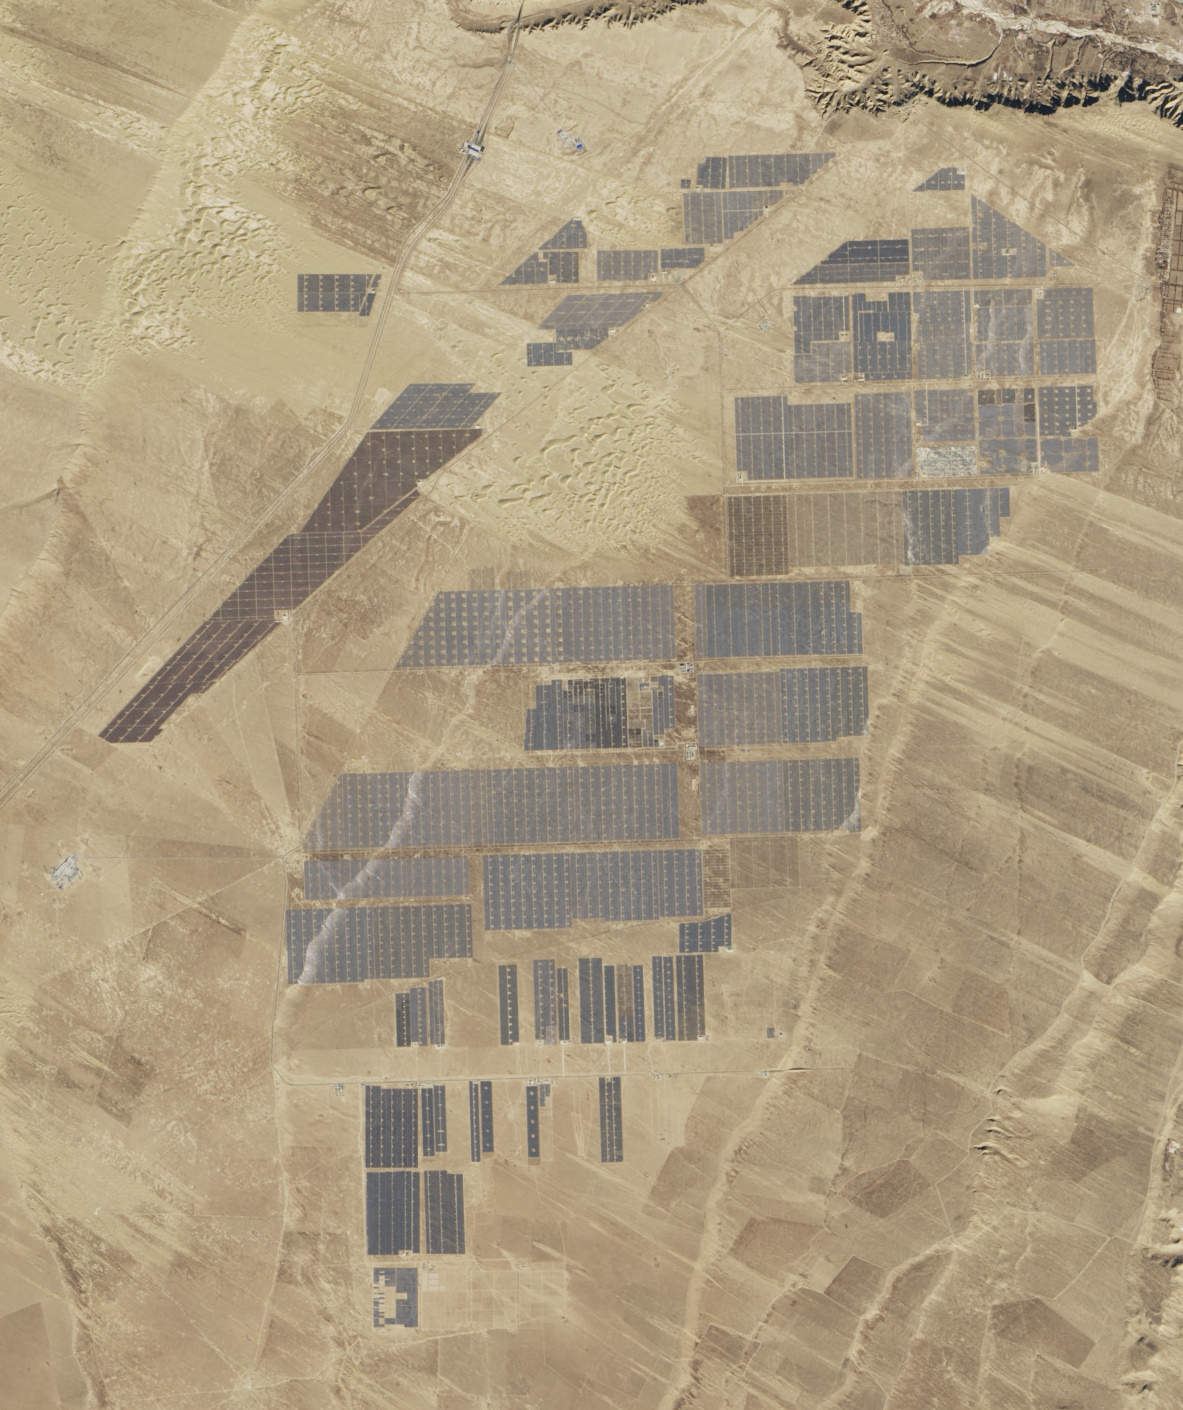

China had 1,202.18 GW of installed solar capacity at the end of 2025, about half of the world's 2,391.47 GW, according to Ember data compiled on Wikipedia. The United States, India, Germany and Japan follow, and together the top five hold roughly 73% of the global total.
This article shows the ranking, explains how to read capacity figures and looks at what separates the leaders.
Top Countries by Installed Solar Capacity: The Ranking at a Glance
| Rank | Country | Installed solar capacity, end of 2025 (GW) | Share of world total |
|---|---|---|---|
| 1 | China | 1,202.18 | 50.3% |
| 2 | United States | 211.61 | 8.8% |
| 3 | India | 135.50 | 5.7% |
| 4 | Germany | 106.27 | 4.4% |
| 5 | Japan | 92.21 | 3.9% |
| World | 2,391.47 | 100% |
Shares are calculated from the table above. The source reports total solar capacity, and photovoltaic systems make up the great majority of it.
Methodology and Data Sources
The figures come from Ember, an energy think tank, as shown in the Wikipedia article on solar power by country. They measure installed capacity, which is the maximum power the panels can deliver, in gigawatts (GW). Capacity is not the same as electricity actually produced. A solar plant produces its full rated power only in strong sun, so output in gigawatt-hours depends on sunshine hours, panel angle and grid curtailment.
Another detail is the way capacity is counted. Some countries report direct-current (DC) panel capacity and others report alternating-current (AC) output after inverters. The gap can be 10% to 30% in large plants. When you compare countries, check which unit the source uses.
Why China Dominates Solar Capacity
China's 1,202 GW is more than five times the US total of 211.61 GW, and the gap between the first and second place, about 991 GW, is larger than the capacity of every other country in the table. Three reasons stand out.
- Manufacturing scale. China builds most of the world's solar modules and their components, which lowers local costs.
- Policy support. National targets, grid investment and provincial programmes have supported steady build-out.
- Large land and demand. Big desert and plateau sites, such as the Longyangxia park in Qinghai, make utility-scale plants practical, and the country's electricity demand keeps growing.
The United States, India, Germany and Japan
Each of the next four countries has a different model.
The United States combines large utility-scale plants in sunny states with a growing rooftop market. Tax incentives and corporate power purchase agreements have been important drivers.
India has a high solar resource, rising power demand and government auctions for large parks. Its 135.50 GW makes it the third-largest market.
Germany reached 106.27 GW with a much smaller land area and less sunshine. Its strength comes from rooftop systems, feed-in tariffs in the past and auctions today. Our coverage of German rooftop and storage-linked tenders follows the latest rounds.
Japan, at 92.21 GW, installed solar quickly after 2012 under a feed-in tariff, and limited flat land pushes projects onto rooftops and reclaimed sites.
Capacity vs Generation vs Per Capita
A fair ranking needs more than one measure. Capacity shows the size of the fleet. Generation share shows how much of a country's electricity comes from solar. Capacity per person shows how intensively solar is used. A smaller country such as Germany ranks much higher per person than its absolute place suggests, while India ranks lower per person than it does in total.
This matters for energy security. A country can be a top-five solar builder and still depend on gas or coal for the evening peak, because solar needs storage or flexible plants to cover the hours after sunset.
What the Numbers Mean for Energy Markets
Because solar capacity is so concentrated, policy decisions in China shape global module prices. Cheap modules help every other market, but they also raise questions about supply-chain dependence. For grids, the main challenge is no longer building panels. It is connecting them, storing the energy and adding flexible capacity.
Expect the ranking of the top five to stay stable in the short term, while countries in the Middle East, Southeast Asia and Africa grow from lower bases.
Frequently Asked Questions About Solar Capacity by Country
Which country has the most solar power? China, with 1,202.18 GW at the end of 2025.
What is the world's total installed solar capacity? 2,391.47 GW in 2025, according to Ember data.
Is installed capacity the same as electricity generated? No. Capacity is the maximum power. Generation depends on sunshine, curtailment and grid conditions.
Which European country has the most solar? Germany, with 106.27 GW.
How Solar Capacity Is Measured
Solar capacity is expressed in megawatts (MW) or gigawatts (GW) and describes the maximum power a fleet of panels can deliver under standard conditions, not the energy they actually produce over a year. Two details cause confusion. First, some countries report DC capacity, the rating of the panels, while others report AC capacity, the output after inverters convert the power for the grid. The DC figure is usually higher, so comparing countries that use different conventions can overstate gaps. Second, capacity factor measures how much of the theoretical maximum a plant actually delivers over time. Because the sun does not shine at night and varies with latitude, weather and tracking technology, solar capacity factors are much lower than those of many conventional plants.
Capacity is also split between utility-scale plants, built by developers and connected to the high-voltage network, and distributed systems such as rooftop panels on homes and businesses. Some countries lean heavily on rooftops, while others build mainly large solar parks, which affects how quickly capacity can be added and how it is integrated into the grid.
Common Misreadings of Capacity Rankings
A ranking by installed capacity favours large countries. A smaller country can lead the world in solar share or per-person capacity while sitting far below the top ten in absolute gigawatts. Rankings also change quickly: a year of rapid installation can move a country several places, so always check the data year. Finally, installed capacity is not the same as electricity delivered. Grid congestion, curtailment and storage availability decide how much solar power reaches consumers. Treat the table in this article as a snapshot of build-out, and combine it with generation and share-of-electricity data when you need to judge real impact.
Conclusion
China leads installed solar capacity with about half of the world's total, and the next four countries add roughly another quarter. Read the ranking with capacity, generation and per-person measures side by side, and always check the data year. The Daily Energy will update this ranking as new Ember data arrives.
Source: Wikipedia, Solar power by country (Ember data, end of 2025; accessed 4 Nov 2026). Shares calculated by The Daily Energy from the table.