US Shale Oil Explained: Basins, Output and Costs
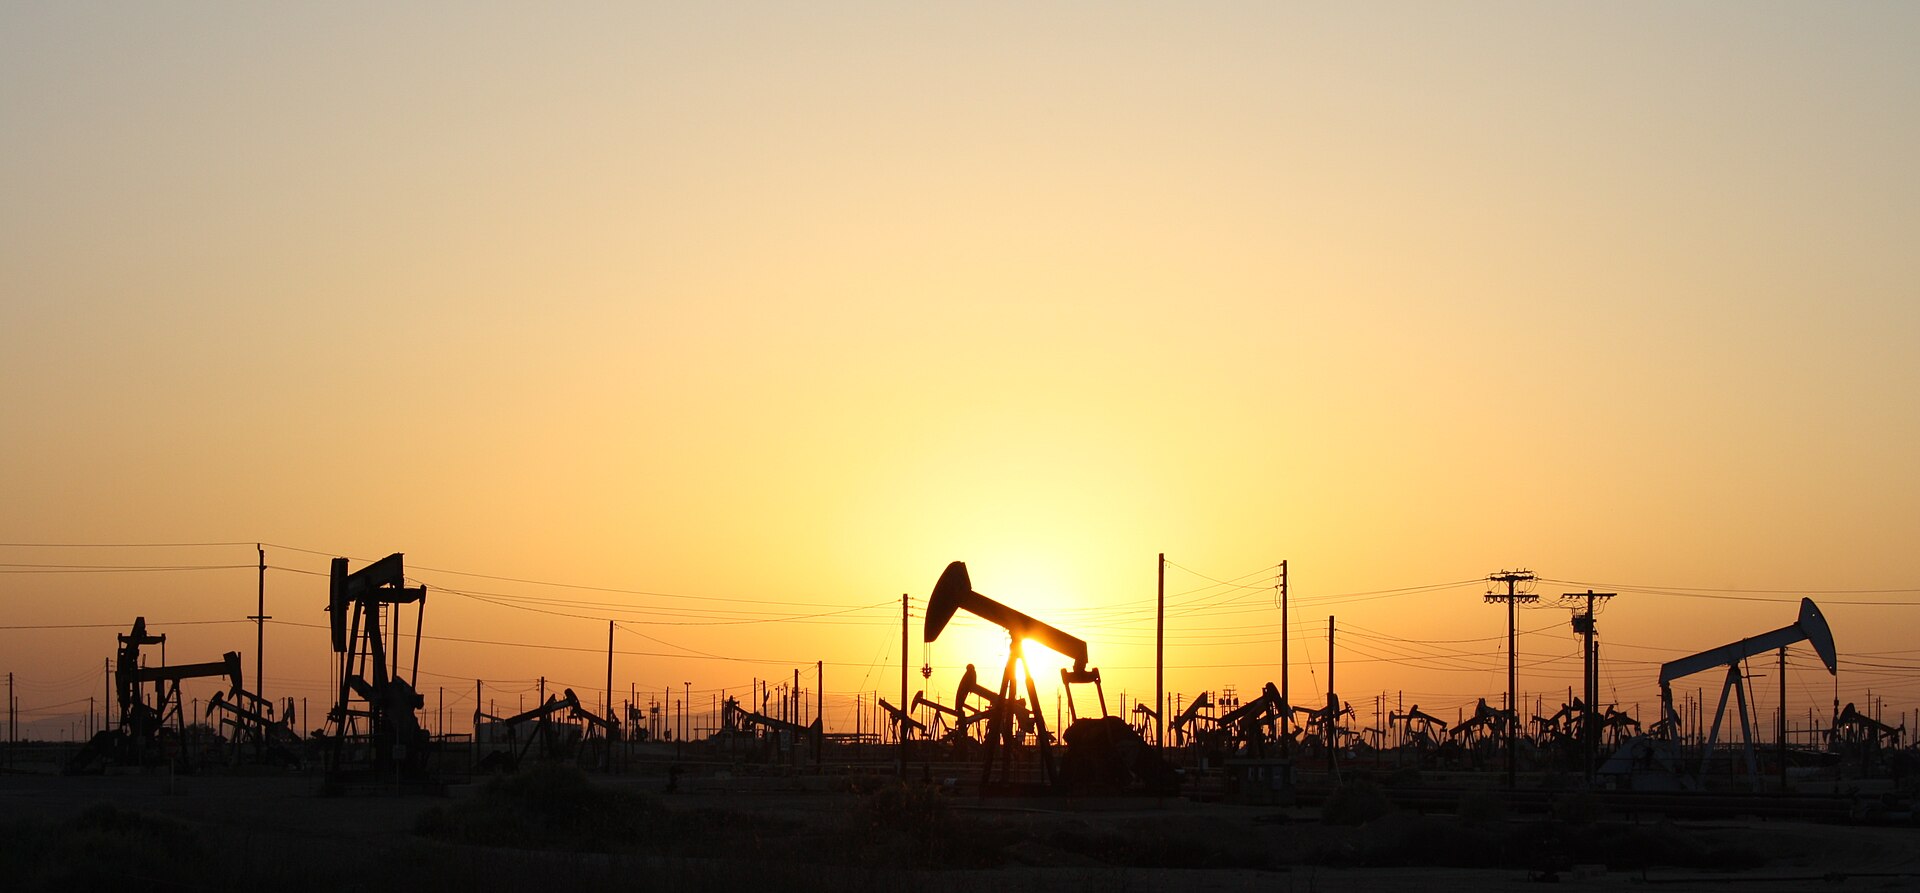

US shale oil is crude oil trapped in tight rock formations that became economic to produce once operators combined horizontal drilling with hydraulic fracturing. Technically it is often called tight oil, because the oil sits in low-permeability shale, siltstone and sandstone. Over roughly fifteen years this resource turned the United States from a growing importer into the world’s largest crude oil producer, changing prices, trade flows and geopolitics.
US Shale Oil: Overview and Key Concepts
Conventional oil flows from porous reservoirs into a well with relatively little help. Shale rock is so tight that oil barely moves through it, so each well has to be drilled horizontally through the layer, often for two miles or more, and then fractured with high-pressure fluid and sand to create pathways for the oil.
The US Energy Information Administration (EIA) reports that tight oil makes up well over half of US crude oil production. The sector grew from a small base in the late 2000s to a scale that rivals the output of the largest conventional producers. Because the technology is repeatable, production can be added in months rather than years, which is unusual in the oil industry.
How a shale well behaves
Shale wells start strongly and then decline steeply. Output often falls by more than half in the first year, then flattens into a long tail. To keep production flat, operators have to keep drilling new wells, which is why shale is sometimes described as a treadmill. This pattern also explains why output reacts quickly to price changes.
The technology in brief
Three advances work together. Horizontal drilling places a long section of the well inside a thin productive layer. Multi-stage hydraulic fracturing divides that section into many zones, each fractured in turn. Finally, better imaging and data analysis help operators choose where to place the wells and how closely to space them. Each element existed for years before the boom; the shale revolution came from combining them at scale, a process that began in natural gas shale in Texas and was then applied to oil-rich formations.
Main Basins and Resources
Shale oil is spread across several regions, each with its own geology and cost profile.
| Basin or play | Location | Notes |
|---|---|---|
| Permian Basin | West Texas and southeast New Mexico | Largest source of US crude; stacked layers and associated gas |
| Bakken | North Dakota and Montana | Early shale oil success; long-lateral wells |
| Eagle Ford | South Texas | Close to Gulf Coast refineries and ports |
| Niobrara (DJ Basin) | Colorado and Wyoming | Mix of oil and gas; regulatory constraints are stricter |
| Anadarko plays | Oklahoma | Multiple formations; higher water volumes |
The Permian Basin dominates. According to EIA data, it accounts for the largest single share of US crude output, in the order of 40 to 50 percent depending on the month, and most of the growth in recent years. Its many stacked formations let operators drill several layers from the same area, lowering infrastructure costs per barrel.
Major Companies and Projects
The industry includes large integrated companies, large independents and many smaller private operators. ExxonMobil, Chevron, Occidental, ConocoPhillips, EOG Resources, Devon Energy and Diamondback Energy are among the best known in the Permian and other basins. Consolidation has been a theme: larger companies have acquired shale-focused firms to secure drilling inventory, as when ExxonMobil agreed to buy Pioneer Natural Resources, a leading Permian producer.
Private companies still produce a meaningful share of output. They tend to respond more directly to prices than publicly listed firms, which have faced investor pressure to return cash rather than grow production at any cost.
Costs and Economics of US Shale Oil
The cost of producing US shale oil depends on location, well design, service prices and the quality of the acreage. The cheapest sweet spots can be profitable at prices well below the industry average, while marginal acreage needs much higher prices. The Federal Reserve Bank of Dallas publishes a regular energy survey in which executives report the price they need to profit on new wells, and it is a useful benchmark. Treat the figures as ranges that move with cost inflation and technology.
- Drilling and completion: the largest cost, driven by lateral length, sand and water volumes.
- Service costs: rigs, crews and equipment are priced cyclically.
- Operating costs: lifting, water handling and transport.
- Royalties and taxes: paid to landowners and governments.
- Gas by-product: associated gas can be an income stream or a cost, depending on pipeline access.
Efficiency gains have been substantial. Longer laterals, better targeting and faster drilling cut the cost per barrel for years. More recently, the best acreage has been drilled first, so operators face rising pressure to keep productivity up as inventory matures.
Infrastructure, Imports and Exports
Shale output required new pipelines, storage and export terminals. Oil from the Permian flows to the Gulf Coast, mainly to Corpus Christi and the Houston area, where it is refined or loaded onto tankers. The United States lifted its long-standing ban on most crude oil exports in late 2015, which allowed shale producers to sell to the world. Since then the country has become a significant crude and refined product exporter, even though it still imports certain grades that suit its refineries.
Midland, Texas, is the key pricing and trading point for Permian crude, linked to the West Texas Intermediate benchmark that is a reference for global oil prices. Pipeline capacity and export terminal capacity can create temporary bottlenecks and price differences between inland and coastal locations.
What US Shale Oil Means for Global Energy Markets
Shale gave the market a flexible supplier outside OPEC. When prices rise, US producers can add output within months, which caps price spikes. When prices fall, activity declines quickly and supply growth slows. This responsiveness is one reason why other exporters pay close attention to the US rig count and to monthly production estimates.
Producer alliances are also adapting. OPEC+ policy decisions are made with US supply growth in mind, and membership has been fluid: the United Arab Emirates left OPEC and OPEC+ effective 1 May 2026. Such changes show how supply-side alliances can shift, while shale remains a market-driven source of supply.
Risks and Challenges
- Price volatility: low prices curb drilling and can strain smaller producers.
- Inventory depth: top-quality drilling locations are finite and the best are being used first.
- Water management: large volumes of produced water must be recycled or disposed of safely.
- Induced seismicity: wastewater injection has been linked to earthquakes in parts of Oklahoma and Texas, leading to regulatory limits.
- Methane and flaring: emissions rules and public scrutiny are rising.
- Policy shifts: permitting, leasing and tax rules change with administrations.
Frequently Asked Questions About US Shale Oil
Is shale oil the same as oil shale?
No. Shale oil is liquid crude trapped in rock and produced through wells. Oil shale is rock containing kerogen, which must be heated to yield oil, and it has little commercial output.
Which basin produces the most?
The Permian Basin in Texas and New Mexico, by a wide margin.
Why do shale wells decline so fast?
Fractures near the well drain quickly, and the very tight rock supplies oil to them only slowly.
Does the US export shale oil?
Yes. Crude oil exports have been permitted since late 2015, and the US also exports refined products and natural gas liquids.
Will US shale oil production keep growing?
That depends on prices, costs, capital discipline and the quality of remaining acreage. The EIA publishes regular forecasts that readers can check.
Conclusion
US shale oil reshaped global supply by adding a fast-responding, market-driven producer. Its future rests on cost control, the depth of high-quality drilling locations and policy choices. For anyone following oil markets, watching Permian output, rig activity and break-even surveys gives the clearest signal of where supply is heading.
Sources and further reading
- US Energy Information Administration (EIA), Drilling Productivity and Short-Term Energy Outlook: eia.gov
- Federal Reserve Bank of Dallas, Dallas Fed Energy Survey: dallasfed.org
- International Energy Agency, oil market reports: iea.org
- Energy Institute, Statistical Review of World Energy: energyinst.org
- Texas Railroad Commission, oil and gas regulator: rrc.texas.gov