Largest Wind Farms in the World
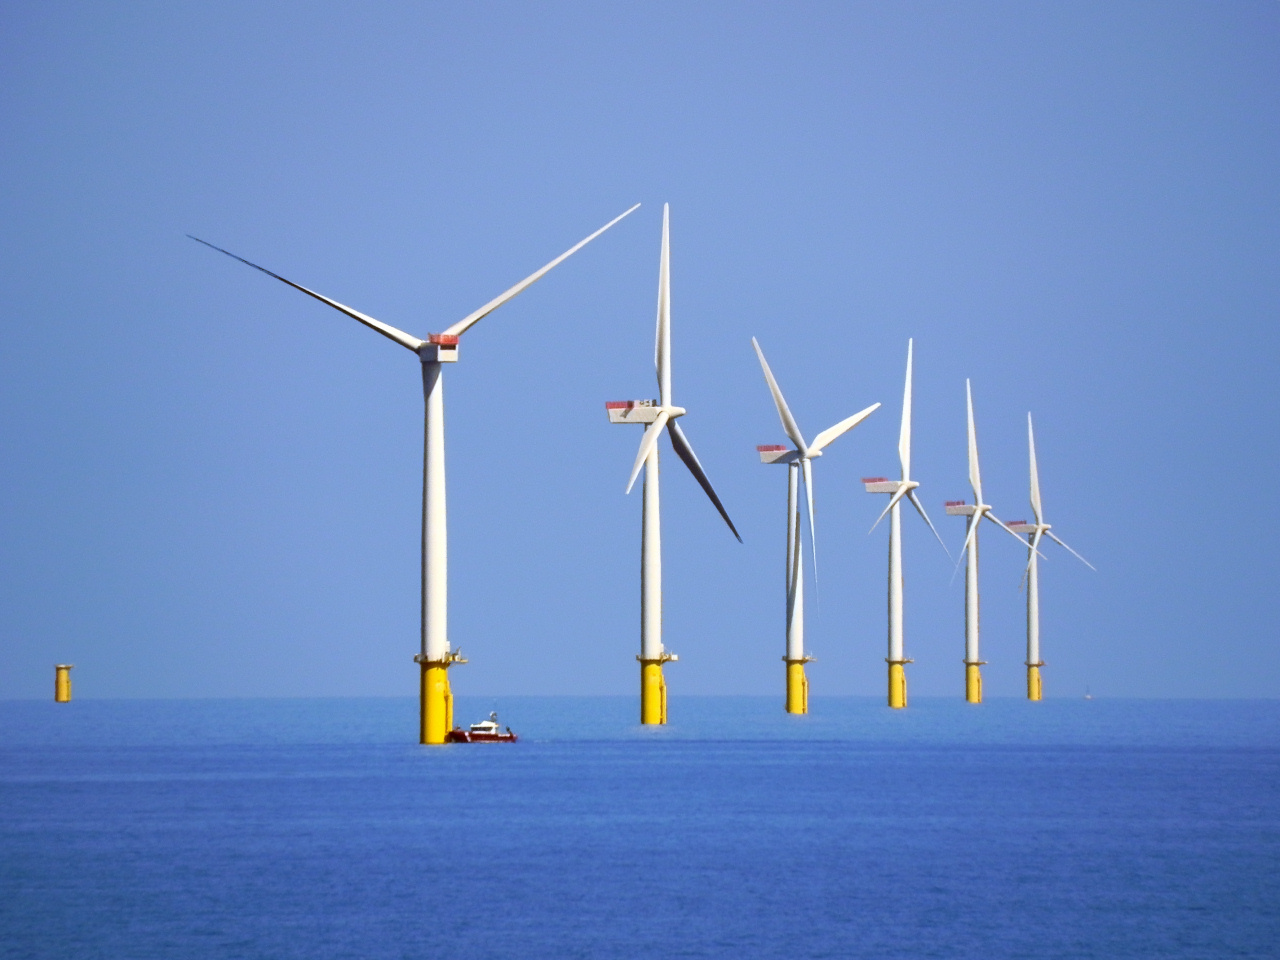

The largest wind farms in the world are measured by installed capacity in megawatts, and the leaders are a mix of vast onshore complexes in China, India and the United States and giant offshore projects in the North Sea. Rankings differ depending on whether you count a single site, a cluster of projects or a planned build-out. This article explains how the lists are built, profiles the main leaders and shows what the numbers mean for energy markets.
The Largest Wind Farms: The Ranking at a Glance
No single official ranking exists. Different sources, including Wikipedia lists, trade press and developer announcements, count capacity differently, and projects are often expanded in phases. The table below gives approximate capacities for some of the best-known projects. Treat the figures as indicative and confirm with the operator or a current database before quoting them.
| Wind farm | Location | Type | Approximate capacity |
|---|---|---|---|
| Gansu Wind Farm (Jiuquan) | Gansu, China | Onshore cluster | Several GW, with long-term plans far higher |
| Dogger Bank | North Sea, UK | Offshore, three phases | About 3.6 GW when complete |
| Muppandal cluster | Tamil Nadu, India | Onshore, many owners | About 1.5 GW |
| Alta Wind Energy Center | California, US | Onshore | About 1.5 GW |
| Hornsea 2 | North Sea, UK | Offshore | About 1.4 GW |
| Hornsea 1 | North Sea, UK | Offshore | About 1.2 GW |
| Markbygden Ett | Sweden | Onshore | About 1.1 GW |
| Jaisalmer Wind Park | Rajasthan, India | Onshore | About 1 GW |
One gigawatt (GW) equals 1,000 megawatts (MW). A project of 1 GW can supply electricity for roughly the annual needs of several hundred thousand homes, depending on the wind resource and local consumption.
Methodology and Data Sources
To compare projects fairly, a few points need to be settled.
What counts as one wind farm?
Some entries are single projects built by one developer under one grid connection. Others, like the Gansu complex or the Muppandal area, are clusters of many separately owned plants that share a region. Lists that merge clusters will rank them higher than lists that separate them.
Installed versus planned capacity
Many headline numbers are targets. A planned build-out of tens of gigawatts is not the same as turbines that are operating. For rankings that mean anything, count only capacity that is installed and connected, and note the date.
Onshore versus offshore
Offshore farms are usually listed separately, because their economics and technology differ. They also tend to be built as single projects with fewer, larger turbines.
Reliable sources include operator websites, national energy agencies, the Global Wind Energy Council (GWEC), the International Renewable Energy Agency (IRENA) and trade databases such as 4C Offshore for offshore projects. When figures conflict, prefer the operator or official statistics.
Profiles of the Leading Projects
Gansu Wind Farm, China
Also called the Jiuquan Wind Power Base, this is a large group of wind plants in the Gobi Desert corridor of Gansu province. It was conceived as a showcase for China’s wind build-out and has been repeatedly cited as the world’s largest wind complex. Reports of its actual operating capacity vary by source and date, partly because it is a group of projects, and curtailment (when power cannot be used or sent) has been a long-running issue.
Dogger Bank, United Kingdom
Dogger Bank is a three-phase offshore project in the North Sea, roughly 130 kilometres off the English coast. Its planned capacity of about 3.6 GW would make it the largest offshore wind farm in the world once complete. It uses some of the largest turbines available and high-voltage direct current transmission to bring power ashore. Check the developers for the latest construction status.
Hornsea 1 and 2, United Kingdom
The Hornsea projects, also in the North Sea, were each among the largest offshore wind farms in operation when they started. They are large enough to power a meaningful share of British homes, and they show how quickly turbine sizes have increased.
Alta Wind Energy Center, United States
In the Tehachapi Pass area of California, Alta is among the largest onshore projects in the United States by capacity, built in phases by different owners. The region is a long-standing wind hub close to Los Angeles demand.
Indian clusters: Muppandal and Jaisalmer
In India, wind capacity is concentrated in Tamil Nadu, Gujarat, Rajasthan and Karnataka. Muppandal in Tamil Nadu is one of the oldest and largest clusters, and Jaisalmer Wind Park in Rajasthan is a large single complex in the Thar Desert.
Markbygden, Sweden
Markbygden in northern Sweden is among the largest onshore projects in Europe, built in stages on forestry land with a long-term capacity ambition much larger than the first phases.
Why the Largest Wind Farms Dominate
The largest wind farms share a few traits. Understanding them explains why the same regions keep appearing.
- Strong, consistent wind: deserts, plains, mountain passes and shallow seas offer high capacity factors.
- Space and low land conflict: sparsely populated areas such as the Gobi, Thar and northern Sweden allow thousands of turbines.
- Grid connection and demand: big projects need transmission lines to carry power to cities and industrial centres.
- Policy and financing: auctions, long-term contracts and cheap capital allow developers to build at scale.
- Turbine technology: larger turbines mean fewer foundations and more output per site, especially offshore.
Supply chain and port capacity also matter. Offshore megaprojects require specialised vessels, harbours and cable factories, which limit the number of places able to host them.
Regional Trends and Surprises
China leads by installed wind capacity, according to GWEC and IRENA, and is also the largest manufacturer. Europe leads in offshore deployment, particularly around the North Sea, where the UK, Germany, Denmark and the Netherlands have large pipelines. The United States has strong onshore markets in Texas and the Midwest, with offshore wind advancing more slowly.
Some surprises are worth noting:
- Offshore projects are catching up with the largest onshore complexes in single-site size, even though onshore wind still provides most global capacity.
- The biggest onshore entries are clusters, not single farms, and some are held back by transmission shortages.
- Hybrid designs that combine wind, solar and storage are increasingly proposed in the same regions.
- Floating wind is moving from pilots to commercial scale and may open deep-water sites that fixed foundations cannot reach.
What the Numbers Mean for Energy Markets
Capacity is not the same as generation. A wind farm rated at 1 GW will produce less than 1 GW on average, since the wind does not blow at full strength all the time. Capacity factors of roughly 25 to 45 percent are common onshore and often higher offshore, so the same rated capacity yields more energy at sea.
For markets, big wind farms lower the average wholesale price at times of strong wind, which can push prices down and sometimes cause curtailment. They increase the need for flexibility from storage, interconnectors and responsive demand. They also concentrate risk: a large offshore farm depends on a single export cable and a single substation. Grid planning, not turbine supply, is now often the limiting factor.
When comparing the largest wind farms, always ask what the number measures, when it was recorded and whether it is installed or planned.
Frequently Asked Questions About the Largest Wind Farms
What is the largest wind farm in the world?
By complex size, the Gansu Wind Farm in China is generally cited as the largest onshore group. For a single offshore project, Dogger Bank in the UK is planned to be the largest when all phases are complete.
What is the largest offshore wind farm?
Dogger Bank is expected to hold that title at full build. Hornsea 2 and other Chinese and European projects have also held the record at different times.
How many homes can a 1 GW wind farm power?
It depends on the wind and local consumption, but typically several hundred thousand homes over a year.
Why do rankings change so often?
Projects are completed in phases, new ones are commissioned, and sources count clusters in different ways.
Where can I find current data?
Use GWEC, IRENA, national energy agencies and the operators’ websites.
Conclusion
The largest wind farms show how far wind power has scaled, from desert complexes in China and India to giant offshore arrays in the North Sea. The ranking depends on definitions, so check whether a figure is installed or planned, and whether it describes one project or a cluster. For markets, the lesson is that grids, storage and permitting now matter as much as turbine size. For current numbers, confirm with the operator or a recent industry database.
Sources and further reading
- Global Wind Energy Council, Global Wind Report (gwec.net)
- International Renewable Energy Agency, renewable capacity statistics (irena.org)
- International Energy Agency, wind electricity tracking (iea.org)
- U.S. Energy Information Administration, wind explained (eia.gov)
- Ember, global electricity data (ember-energy.org)
- Dogger Bank Wind Farm project partners (doggerbank.com)