Largest LNG Exporting Countries
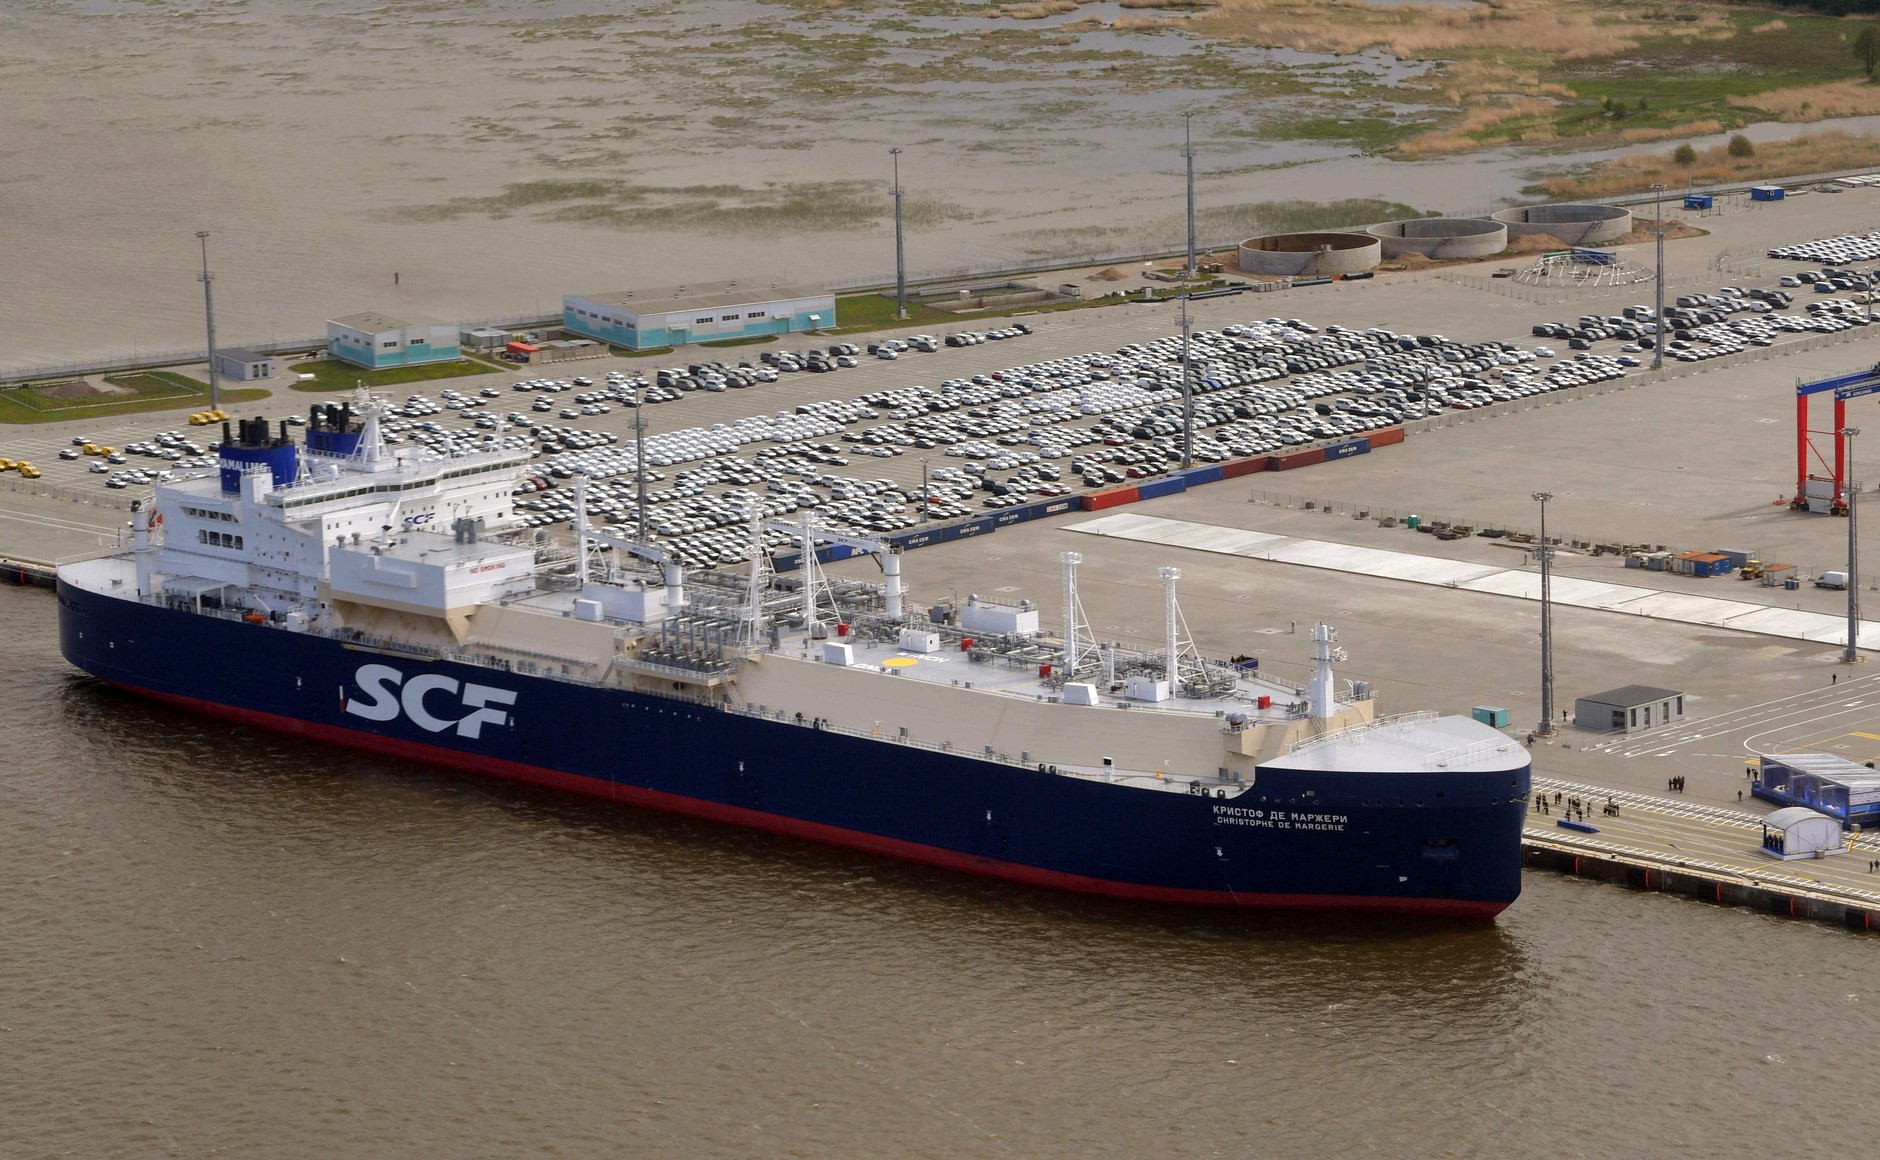

The largest LNG exporters are the United States, Qatar, Australia and Russia, followed by Malaysia, Nigeria, Indonesia and a group of mid-sized suppliers such as Algeria, Oman, Norway and Trinidad and Tobago. Since 2023 the United States has held the top spot, overtaking Qatar and Australia, and its lead has widened as new export terminals came online. This article ranks the main exporters by volume, explains how the data is compiled and looks at what the ranking means for gas markets.
Largest LNG Exporters: The Ranking at a Glance
Global liquefied natural gas trade reached a record in 2025, according to the International Group of Liquefied Natural Gas Importers (GIIGNL), with the increase of roughly 22 million tonnes over the previous year coming almost entirely from the United States. The US Energy Information Administration (EIA) also reported record global LNG trade for the year, driven by US exports. Qatar likewise set a record for its own shipments.
The simple version of the league table looks like this:
- United States: the clear leader by volume, with exports above 100 million tonnes a year.
- Qatar and Australia: both in the region of 75 to 85 million tonnes a year, with the order between them changing from year to year.
- Russia: in the 30 to 35 million tonne range.
- Malaysia: the leading mid-sized Asian exporter, in the mid-twenties of millions of tonnes.
- Nigeria, Indonesia, Algeria, Oman, Norway, Trinidad and Tobago: smaller suppliers that fall between roughly 8 and 16 million tonnes each.
Methodology and Data Sources
Rankings of LNG exporters are not identical across sources, because organisations count slightly different things. Before comparing numbers, it helps to know how they are compiled.
- Volume unit. Most reports use million tonnes per annum (mtpa) of LNG. Others use billion cubic metres or billion cubic feet per day of gas, which must be converted.
- Exports versus capacity. Nameplate liquefaction capacity is what a country can produce in theory. Exports are what actually shipped, and they are usually lower.
- Re-exports. Some data sets include cargoes that are reloaded from import terminals, which are small compared with primary exports.
- Source differences. GIIGNL, the EIA, the Energy Institute’s Statistical Review, the International Gas Union and shipping trackers all publish annual figures. Totals can vary slightly.
Figures in this article are described as approximate bands and rely on the annual reports of GIIGNL and the EIA. For an exact number in a specific year, always consult the latest edition of those reports.
Top 10 Breakdown
| Rank (approx.) | Country | Approximate scale | Key facts |
|---|---|---|---|
| 1 | United States | Above 100 Mt | Sabine Pass, Cameron, Freeport, Corpus Christi, Calcasieu Pass, Plaquemines, Cove Point and others |
| 2 to 3 | Qatar | About 75 to 85 Mt | Ras Laffan; North Field expansion under way |
| 2 to 3 | Australia | About 75 to 85 Mt | Gorgon, Wheatstone, Ichthys, Queensland projects, North West Shelf |
| 4 | Russia | About 30 to 35 Mt | Yamal LNG and Sakhalin-2, with new projects hit by sanctions |
| 5 | Malaysia | Mid-twenties Mt | Bintulu complex and floating units |
| 6 to 10 | Nigeria, Indonesia | Roughly 14 to 16 Mt each | Nigeria LNG; Bontang and Tangguh |
| 6 to 10 | Algeria, Oman, Norway, Trinidad and Tobago | Roughly 8 to 12 Mt each | Established plants with long-term buyers |
Newer exporters are also climbing. Canada started shipping from its Pacific coast project, Mozambique is developing floating and onshore LNG, and Papua New Guinea, Argentina and others have ambitions to scale up. The exact ranks within the lower tier change with plant outages and new launches.
Why These Leaders Dominate
United States
The shale revolution created a huge domestic gas surplus, and Henry Hub pricing gives exporters low-cost feedgas. Flexible contracts, with no fixed destination, allow cargoes to flow wherever prices are best. A wave of projects approved in the 2010s and early 2020s is now delivering capacity.
Qatar
Qatar owns an enormous, low-cost gas field and a vertically integrated system of production, liquefaction and shipping. Long-term contracts with Asian and European buyers underpin its position, and QatarEnergy has planned a major capacity increase.
Australia
Australia built a cluster of large export plants in the 2010s, mainly serving Japan, China and South Korea. Its position is strong but has been affected by feedgas supply issues and ageing plants at some sites.
Russia
Russia uses Arctic and Pacific projects, including Yamal LNG, to supply Asia and Europe. Sanctions have limited access to equipment and financing for newer projects, which constrains growth.
Regional Trends and Surprises
- Atlantic basin is growing fastest. The increase in US output moved the centre of gravity of supply from the Gulf and Asia-Pacific towards the Gulf of Mexico.
- Europe became a major buyer. After the cut in Russian pipeline gas, Europe imported more LNG, much of it American.
- Asia remains the largest demand centre. China, Japan, South Korea and India dominate imports, though price sensitivity varies sharply from year to year.
- Mid-sized exporters face plant ageing. Some older facilities in Trinidad, Algeria and Indonesia have struggled with feedgas decline and outages.
- Africa is a swing region. Nigeria operates one of the largest plants on the continent, while Mozambique and others aim to add volume.
What the Numbers Mean for Energy Markets
For buyers, the growth of the largest LNG exporters has widened supply options and reduced reliance on a single source or pipeline route. A larger share of cargoes sold without destination restrictions makes the market more liquid and encourages short-term trading.
For prices, new supply from the US and later from Qatar is expected to ease tightness, although outages, weather, shipping bottlenecks and demand swings still cause volatility. The concentration of capacity around the Strait of Hormuz and the US Gulf Coast also matters: disruptions at either location, such as hurricanes or regional tensions, can move global prices quickly.
For policy makers, ranking LNG exporters is also about energy security and climate. Methane emissions, flaring and the carbon intensity of liquefaction increasingly affect how buyers choose suppliers.
Frequently Asked Questions About the Largest LNG Exporters
Which country exports the most LNG?
The United States, which became the largest exporter in 2023 and has continued to expand its lead as new plants began operating.
Is Qatar still one of the largest LNG exporters?
Yes. Qatar remains among the top three, and reported record export volumes for 2025. Its planned expansion should lift volumes further.
How is LNG export volume measured?
Mostly in million tonnes per annum, using customs, terminal and shipping data compiled by GIIGNL and national agencies.
Why do different reports show slightly different rankings?
Because they use different definitions, such as including re-exports, and different data collection methods.
Will the ranking change soon?
Possibly in the lower and middle tiers. New projects in Canada, Qatar and elsewhere will shift the balance, but the top positions are likely to stay with the biggest producers for years.
Conclusion
The largest LNG exporters, led by the United States, Qatar, Australia and Russia, account for the bulk of global supply, and the market is growing as new terminals start operating. Readers who want precise numbers should use the latest GIIGNL and EIA reports, since volumes change every year. The broader point is that LNG supply is becoming more diverse and more competitive, which matters for energy security, prices and climate strategies alike.
Sources and further reading
- International Group of Liquefied Natural Gas Importers (GIIGNL), Annual Report (giignl.org)
- U.S. Energy Information Administration, Today in Energy and LNG export data (eia.gov)
- Energy Institute, Statistical Review of World Energy (energyinst.org)
- International Energy Agency, Gas Market Report (iea.org)
- International Gas Union, World LNG Report (igu.org)