Largest Hydropower Dams in the World

The world’s largest hydropower plants are concentrated in China and South America, and they are ranked by installed capacity, measured in megawatts (MW). China’s Three Gorges Dam leads the list by a wide margin, followed by Baihetan, the Itaipu Dam shared by Brazil and Paraguay, and Xiluodu. This guide gives the ranking at a glance, explains how it is measured, looks at why a small group of sites dominates and shows what the numbers mean for electricity markets.
The Largest Hydropower Plants: Ranking at a Glance
The table lists the biggest stations by installed capacity. Figures are approximate and rounded to the values commonly published by operators; capacities can change when units are added or upgraded.
| Rank | Plant | Country | River | Installed capacity (MW, approx.) |
|---|---|---|---|---|
| 1 | Three Gorges | China | Yangtze | 22,500 |
| 2 | Baihetan | China | Jinsha | 16,000 |
| 3 | Itaipu | Brazil / Paraguay | Paraná | 14,000 |
| 4 | Xiluodu | China | Jinsha | 13,860 |
| 5 | Belo Monte | Brazil | Xingu | 11,233 |
| 6 | Guri (Simón Bolívar) | Venezuela | Caroní | 10,235 |
| 7 | Wudongde | China | Jinsha | 10,200 |
| 8 | Tucuruí | Brazil | Tocantins | 8,370 |
Below these sit stations in the 6,000 to 7,000 MW class, including Grand Coulee in the United States at roughly 6,800 MW, as well as other Chinese and Russian plants.
Methodology and Data Sources
Rankings of large dams are easy to misread because the word “largest” can mean several things. This article uses installed capacity, the combined rated output of all turbines. Other valid measures give different answers:
- Annual generation (terawatt-hours): shows how much electricity a plant actually produces. It depends on river flow, reservoir management and grid demand.
- Dam height: China’s Jinping-I is often cited as the tallest dam in the world, at about 305 metres.
- Reservoir volume or surface area: a different list again, led by large reservoirs in Africa and North America.
- Capacity factor: the share of potential output achieved over a year, which highlights how efficiently a site is used.
The numbers here come from operators’ published data and from international sources including the International Hydropower Association, the IEA and the Energy Institute, cross-checked against each other. Capacity figures are rounded and may differ slightly by source depending on whether auxiliary units are counted. Readers who need exact values for a given date should check the operator’s site.
Top Hydropower Plants Breakdown
1. Three Gorges (China)
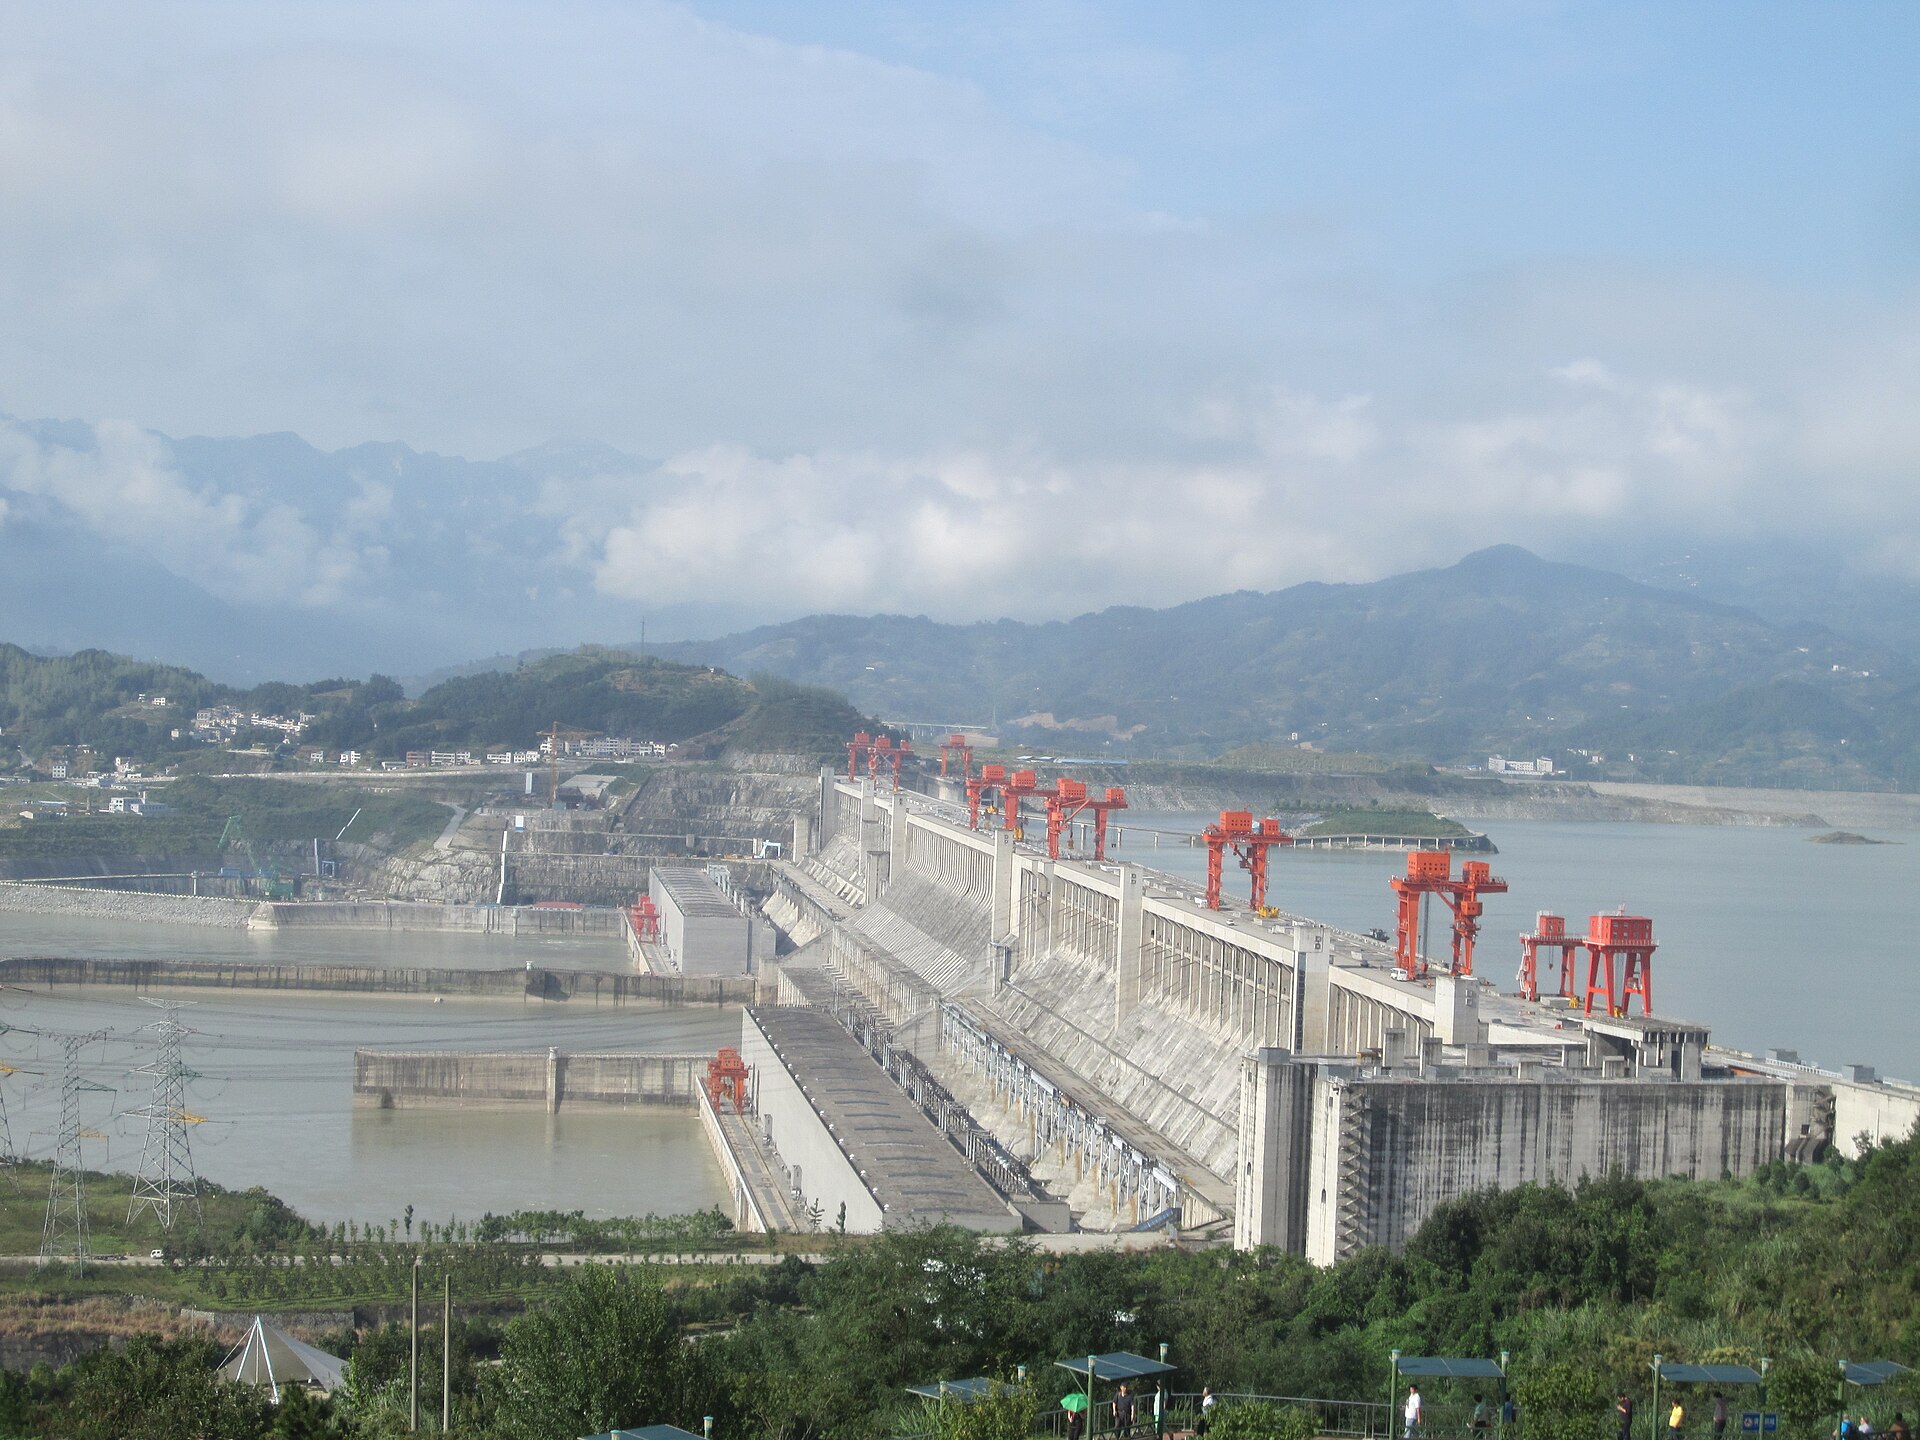
The Three Gorges Dam on the Yangtze holds 32 main turbines of 700 MW each plus two smaller units, adding up to about 22,500 MW. The main structure was completed in the mid-2000s and the full complement of generators operated in the following years. Beyond power, it serves flood control and river navigation through its ship locks. In 2020 it reportedly set a world record for annual hydropower output at roughly 112 terawatt-hours, according to its operator, China Three Gorges Corporation.
2. Baihetan (China)
Baihetan on the Jinsha River has 16 turbines of 1,000 MW each, the largest turbine units of any plant in the world at the time of installation. The station was fully commissioned in 2022 and sends power to eastern China over long-distance ultra-high-voltage lines.
3. Itaipu (Brazil and Paraguay)
Itaipu, on the Paraná River, is jointly owned by the two countries. It has 20 units of 700 MW. Because of its steady river flow it typically generates far more electricity per megawatt than Three Gorges, and it has produced over 100 terawatt-hours in strong years. It supplies most of Paraguay’s electricity and a meaningful share of Brazil’s. Paraguay exports much of its entitlement to Brazil.
4 to 8: Xiluodu, Belo Monte, Guri, Wudongde and Tucuruí
Xiluodu and Wudongde sit on the same Jinsha cascade as Baihetan. Belo Monte on the Xingu in Brazil has a large nameplate capacity, yet its output varies strongly with the seasons, so its average generation is far lower than 11,233 MW. Guri in Venezuela has long supplied much of that country’s electricity, and Tucuruí powers northern Brazil’s grid and industry.
Why These Leaders Dominate
Hydropower scales with two physical factors: the volume of water flowing and the height it falls (head). The best sites combine both, and large rivers with steep drops are rare. China’s Jinsha and Yangtze, Brazil’s Paraná and Tocantins and Venezuela’s Caroní all meet these conditions.
Three further conditions explain the ranking:
- State-backed financing. Projects with decade-long construction schedules and very high upfront costs need public or quasi-public capital.
- Large nearby demand. Eastern China and southeast Brazil have heavy industry and dense cities, plus transmission lines to carry the power.
- Multipurpose design. Flood control, irrigation and navigation share the cost and strengthen the political case.
Regional Trends and Surprises
Four of the top seven plants are Chinese, and most of them form a cascade of dams on the Jinsha River. This shows how a single river basin can be developed in sequence. South America holds four of the top eight, which reflects the region’s high reliance on hydropower.
The United States, Canada and Russia have large older stations, such as Grand Coulee, Robert-Bourassa in Quebec and Sayano-Shushenskaya, but many of the best North American sites were developed in the 20th century. Africa has major untapped potential, with Ethiopia’s Grand Ethiopian Renaissance Dam designed for about 5,150 MW, which would make it the continent’s largest. The Congo River’s Inga site has been studied for decades because of its theoretical size, yet financing and politics have kept it largely undeveloped.
A surprise for many readers is that the biggest plant is not the one with the highest utilisation. Itaipu often outproduces its size, while Belo Monte’s run-of-river design limits output in dry months.
What the Numbers Mean for Energy Markets
Hydropower is the largest renewable source of electricity worldwide, supplying roughly one-seventh of global generation according to IEA data. Large plants provide low-carbon baseload and flexible output that grids need to balance wind and solar. Reservoir plants can store energy in the form of water, ramping within minutes.
The risks are equally real. Droughts reduce output and have forced rationing in countries that depend on hydropower. Large reservoirs displace communities and change ecosystems and sediment flows. Methane emissions from some tropical reservoirs can reduce climate benefits. Hydropower is also increasingly paired with pumped storage, a technology that moves water uphill when power is cheap and releases it when demand peaks, to help absorb variable renewables.
Frequently Asked Questions About the Largest Hydropower Plants
What is the largest hydropower plant in the world?
China’s Three Gorges Dam, with about 22,500 MW of installed capacity.
Is Itaipu bigger than Three Gorges?
Not by capacity, but Itaipu has historically produced a high amount of electricity relative to its size, and for some years it led global annual output before Three Gorges overtook it.
What is the tallest dam in the world?
Jinping-I in China is generally listed as the tallest, at about 305 metres. Height and capacity are separate rankings.
Are there larger hydropower projects planned?
Several very large schemes have been proposed in Asia and Africa. Status changes quickly, so check the developers’ announcements and energy ministries for the latest.
Why does installed capacity differ from actual output?
River flow varies by season and year, reservoirs are managed for multiple uses and grids may not need full output at all times.
Conclusion
The largest hydropower plants are dominated by a handful of mega-projects on powerful rivers in China, Brazil, Paraguay and Venezuela, with Three Gorges at the top of the capacity ranking. Capacity is only one measure, so output, capacity factor and environmental impact give a fuller picture. As grids add more wind and solar, big hydropower stations and pumped storage will keep playing a central role in balancing supply.
Sources and further reading
- International Hydropower Association, Hydropower Status Report (hydropower.org)
- International Energy Agency, hydropower analysis (iea.org)
- Energy Institute, Statistical Review of World Energy (energyinst.org)
- China Three Gorges Corporation (ctg.com.cn)
- Itaipu Binacional (itaipu.gov.br)
- U.S. Energy Information Administration (eia.gov)