Largest Solar Farms in the World
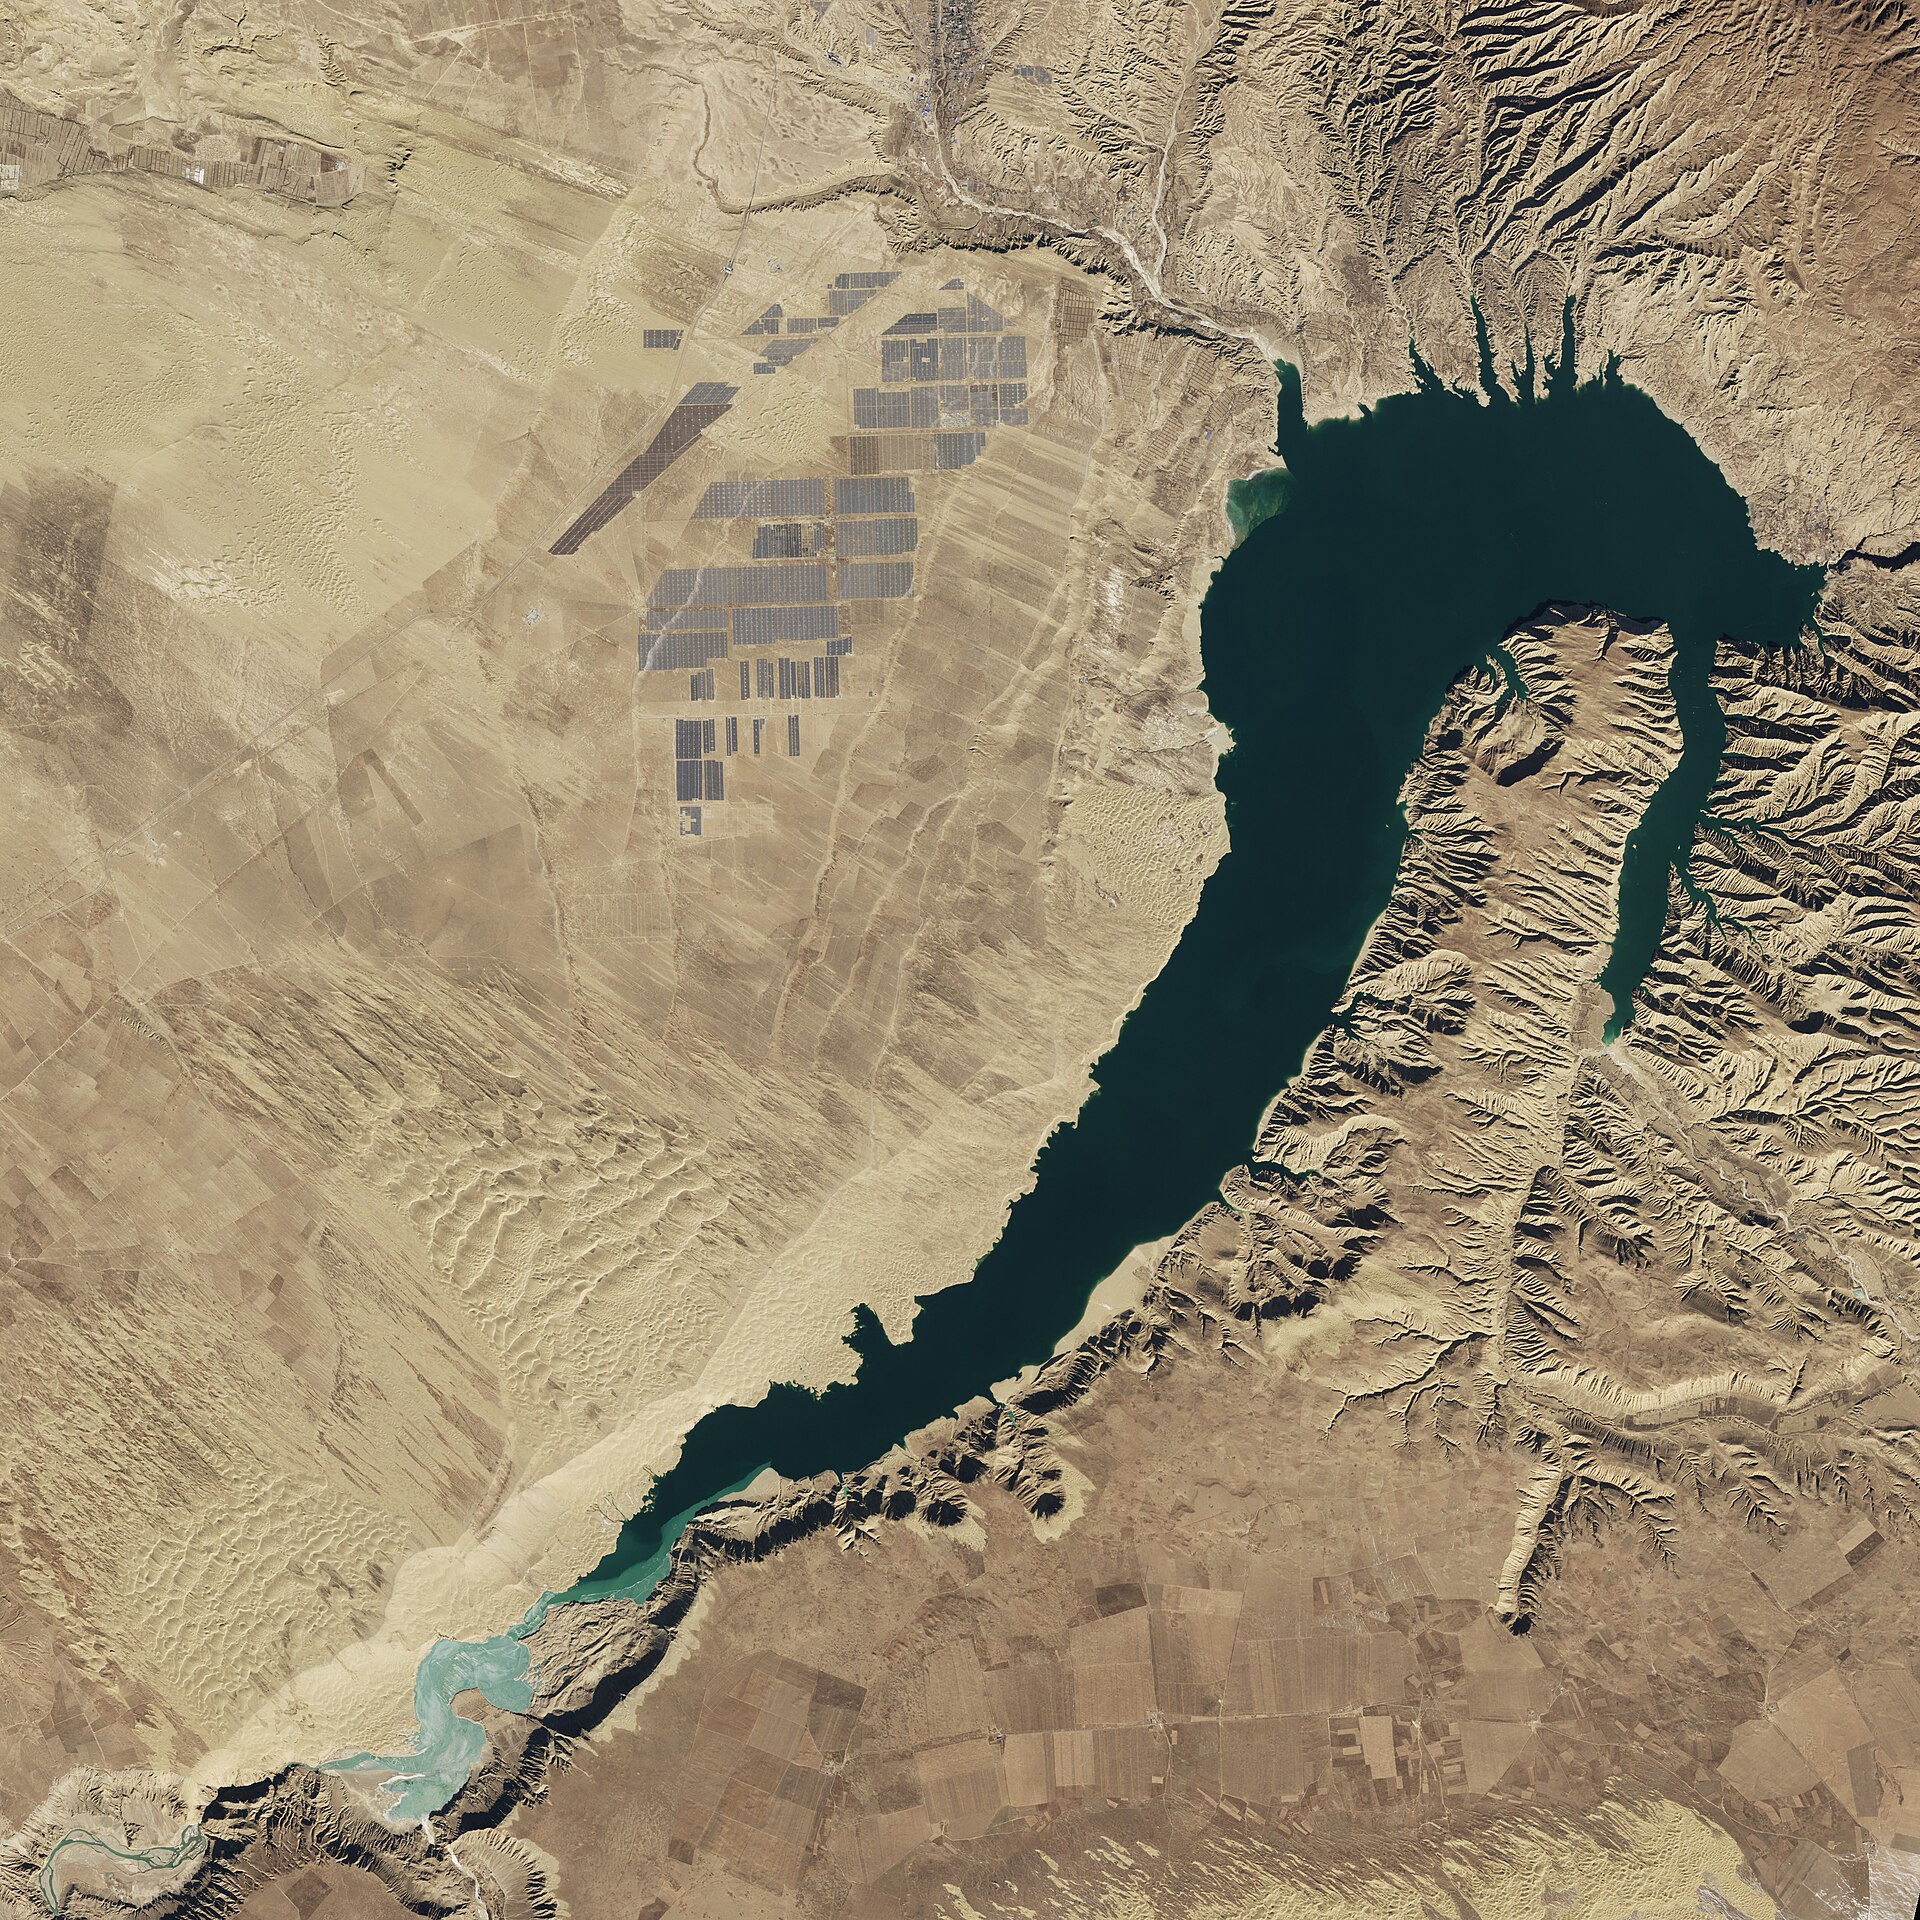

The largest solar farms in the world are concentrated in China, India and the Gulf, and the biggest single complex, the Talatan Solar Park in Qinghai province, China, is reported to exceed 15 gigawatts (GW) of capacity across several phases. Most other mega plants fall between roughly 1 and 3.5 GW. Rankings differ by source because projects are phased, measured in different units and sometimes counted as clusters, so this article explains the numbers as well as listing them.
The Largest Solar Farms at a Glance
A solar farm, also called a solar park or utility-scale photovoltaic plant, is a ground-mounted installation that feeds power into the grid. The very largest sites are built in deserts or on high plateaus with strong sunlight, flat land and low land costs.
- China hosts the biggest complexes, led by the Talatan Solar Park in Qinghai and the Midong plant in Xinjiang.
- India has several of the world’s biggest single sites, including Bhadla and Pavagada.
- The Gulf has built very large, low-cost plants, such as Al Dhafra and Noor Abu Dhabi in the United Arab Emirates.
- Egypt’s Benban park is the largest in Africa.
Methodology and Data Sources
Any ranking of the largest solar farms depends on a few choices, and readers should know them before comparing lists.
- AC or DC capacity: panels are rated in direct current (DC), while the grid connection is in alternating current (AC). A plant listed as 2 GW DC may be about 1.5 GW AC.
- One plant or a cluster: Talatan and Bhadla are made up of many projects built by different owners. Some lists count the whole park, others count individual plants.
- Phases: parks such as Dubai’s Mohammed bin Rashid Al Maktoum Solar Park are developed in stages, and the planned capacity is larger than what is operating.
- Date of data: new plants open quickly, especially in China, so any list goes out of date.
The figures below are approximate nameplate capacities as commonly reported by project owners and compiled in public references such as the List of photovoltaic power stations on Wikipedia. Macro-level context comes from the International Energy Agency (IEA), the International Renewable Energy Agency (IRENA), Ember and the Energy Institute. For exact numbers, check the owner’s announcement or the grid operator’s data.
Top 10 Breakdown of the Largest Solar Farms
| Plant | Location | Approximate capacity | Note |
|---|---|---|---|
| Talatan Solar Park | Qinghai, China | 15 GW or more | Multi-phase cluster, partly paired with hydropower |
| Midong Solar Power Station | Xinjiang, China | About 3.5 GW | Single large project in desert terrain |
| Bhadla Solar Park | Rajasthan, India | About 2.2 GW | Several developers on one site |
| Pavagada Solar Park | Karnataka, India | About 2 GW | Built on leased farmland in a drought-prone area |
| Al Dhafra Solar PV | Abu Dhabi, UAE | About 2 GW | One of the world’s largest single-site plants |
| Benban Solar Park | Aswan, Egypt | About 1.5 GW | Many separate plants in one park |
| Tengger Desert Solar Park | Ningxia, China | About 1.5 GW | Early large Chinese desert project |
| Noor Abu Dhabi | Sweihan, UAE | About 1.2 GW | Set low-price benchmarks when contracted |
| Kurnool Ultra Mega Solar Park | Andhra Pradesh, India | About 1 GW | Multi-developer park |
| Edwards and Sanborn | California, United States | Close to 1 GW of solar | Combined with a very large battery system |
Capacity figures are rounded and may differ by source. Several additional Chinese desert “base” projects were under construction at the time of writing, so the order after the first few entries can change.
How to read the table
Two points help avoid common mistakes. First, the first row is a park made of many projects, while most others are single plants or parks with a few developers, so the gap at the top looks larger than it is for comparable single projects. Second, plants with the same capacity can generate quite different amounts of electricity. Desert sites with tracking systems and strong sunshine, such as those in the Gulf, usually have higher capacity factors than sites in cloudier regions. When comparing plants, look for annual generation in gigawatt-hours if the owner publishes it.
Why These Leaders Dominate
Four factors explain the geography of the largest solar farms.
Strong sunlight and open land
Deserts and high plateaus offer high irradiation and few land-use conflicts. Land is the cheapest input, so developers can build many hundreds of megawatts on one site.
Industrial policy and supply chains
China produces most of the world’s solar modules, which lowers its costs for domestic projects. The IEA has noted that China holds a very large share of every manufacturing stage, from polysilicon to cells and modules.
Auctions and state support
In India and the Gulf, competitive auctions with long power purchase agreements gave developers certainty and pushed tariffs down. Government-backed solar parks also supply ready land and grid connections.
Grid and demand
A mega plant is useful only if the power can be transmitted. Many Chinese projects are linked to high-voltage lines or combined with hydropower and batteries to smooth output.
Regional Trends and Surprises
- Asia leads in size, not in every metric. Chinese complexes dwarf the rest, but the United States and Europe have large fleets made up of many smaller plants.
- The Gulf proved low-cost solar. Record-low tariffs from Abu Dhabi and Dubai auctions made Middle Eastern projects a global benchmark.
- Africa is catching up. Benban showed that big plants can be built quickly in Egypt, and other countries are developing large projects.
- Solar plus storage is becoming standard. New projects increasingly include batteries so that daytime output can serve evening demand.
- Hybrid sites are growing. Solar parks next to hydropower, such as Talatan, use existing transmission and can balance output.
What the Numbers Mean for Energy Markets
Capacity is not output. A 1 GW solar plant typically generates only a fraction of the energy that a 1 GW gas or nuclear plant would produce in a year, because the sun is not available all day. Capacity factors for solar often range from the low teens to around thirty percent, depending on location and tracking. That is why the IEA and others measure electricity generated (in terawatt-hours) as well as installed capacity.
Very large solar farms influence markets in three ways:
- They push down wholesale power prices at midday, which changes the value of other generators.
- They increase the need for storage, flexible gas plants and grid upgrades.
- They make long-term low-price contracts available for industrial buyers, including desalination and green hydrogen projects.
The IEA has reported in recent years that solar PV makes up the majority of new renewable capacity additions worldwide, and mega plants are only part of that: rooftops and mid-sized plants add up to a large share.
Frequently Asked Questions About the Largest Solar Farms
What is the largest solar farm in the world?
The Talatan Solar Park in Qinghai, China, is commonly cited as the largest, with reported capacity above 15 GW when all phases are counted.
What is the largest single solar plant?
This depends on definition. Midong in Xinjiang, at about 3.5 GW, is frequently named as one of the biggest single projects.
What is the largest solar farm in India?
The Bhadla Solar Park in Rajasthan, at roughly 2.2 GW, is typically listed as India’s largest.
How much land does a large solar farm need?
It varies with technology, but utility-scale plants often need several hectares per megawatt, so a multi-gigawatt site covers many square kilometres.
Are bigger solar farms always better?
Not necessarily. Large plants cut costs per unit but need strong transmission. Distributed rooftop systems reduce grid pressure and use already built surfaces.
Conclusion
The largest solar farms show how fast photovoltaic technology has scaled, with single projects now in the multi-gigawatt range. The leaders benefit from good sunlight, cheap land, strong manufacturing and supportive policy. When you read any ranking, check the definition of capacity, whether it counts clusters, and the date, then treat the figures as approximate and verify them with the owner or grid operator.
Sources and further reading
- International Energy Agency (iea.org)
- International Renewable Energy Agency (irena.org)
- Ember (ember-energy.org)
- Energy Institute, Statistical Review of World Energy (energyinst.org)
- US Energy Information Administration (eia.gov)
- NASA Earth Observatory (earthobservatory.nasa.gov)
- Wikipedia, List of photovoltaic power stations (wikipedia.org)